1. Preface
Specific capacity in coin cell testing — measured in mAh/g — is the ratio of electrical charge released by an electrode material to its active material mass, and is the primary metric for evaluating lithium-ion battery material performance at the laboratory scale.
Coin cell testing consistency for specific capacity depends on rigorous control across six process stages: slurry mixing uniformity, electrode coating and drying, calendering, moisture contamination, electrode punching and weighing, and cell assembly parameters such as stacking concentricity and crimp pressure. Variability in any single step can introduce errors exceeding 1.5 mAh/g for cathode materials and up to 20 mAh/g for silicon-based anodes. Automated Coin cell assembly systems from IEST Instrument reduce these deviations by enforcing standardized protocols, cutting material retesting rates significantly.
2. Why Specific Capacity Consistency in Coin Cell Testing Matters
In lithium-ion battery development, new electrode materials progress through five stages before commercialization: laboratory R&D, bench-scale trials, pilot production, scale-up, and commercial deployment. The laboratory stage is where electrochemical performance is first measured and material value is established — making data quality at this stage foundational to everything downstream.
Specific capacity is defined as the electrical charge a battery material can deliver per unit mass of active material, expressed in milliampere-hours per gram (mAh/g). For a lithium-ion electrode, the active material stores and releases electrical energy through electrochemical reactions with lithium ions; specific capacity quantifies how efficiently it does so. As the primary indicator of energy density, specific capacity data must be both accurate and reproducible.
The standard formula is:
| Specific Capacity Formula |
|---|
| Specific Capacity (mAh/g) = Capacity (mAh) ÷ Active Material Mass (g) |
| Example: 1,000 mAh ÷ 10 g = 100 mAh/g |
However, obtaining repeatable specific capacity data from coin cells is notoriously difficult. A 1% drift in electrode coating thickness or a 10‑µm misalignment during assembly can shift capacity readings enough to mask a material’s true potential. This article dissects each processing step and demonstrates how automation, applied through IEST Instrument’s Automated coin cell assembly system, locks in the consistency that manual methods struggle to achieve.

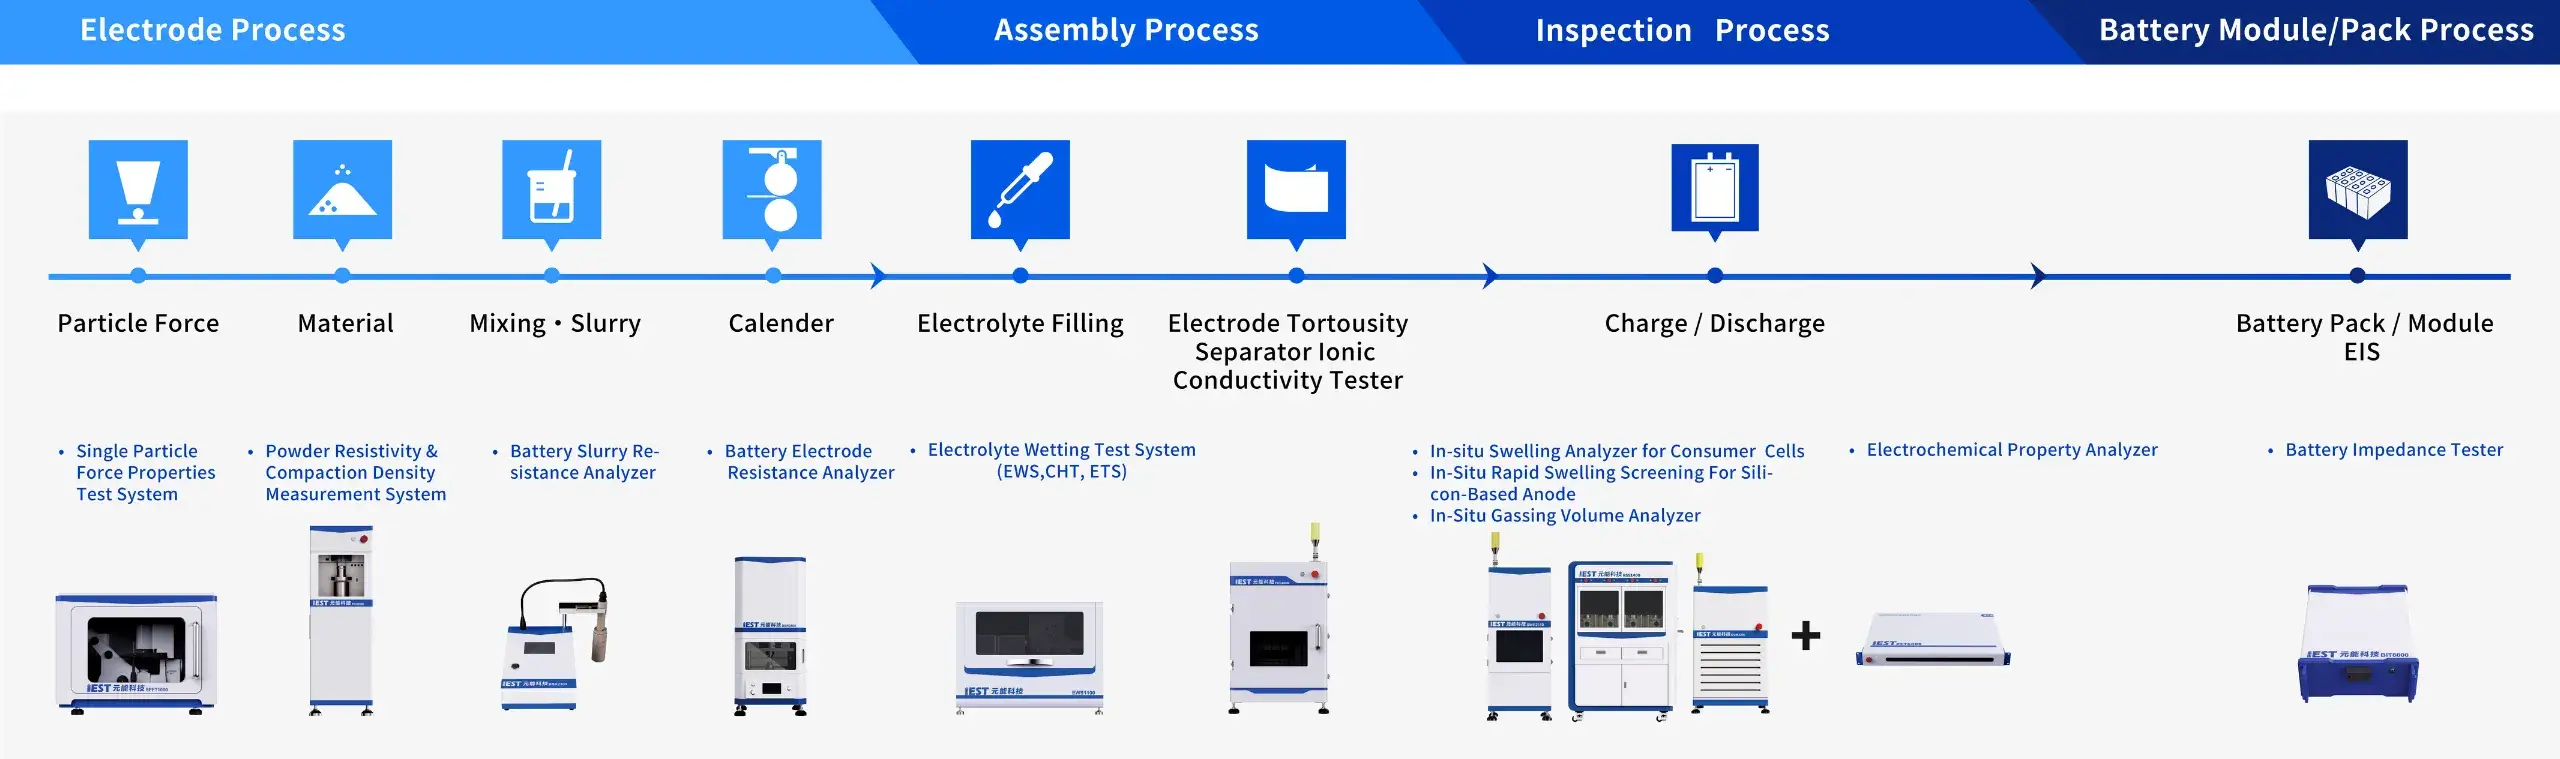
Figure 1. Coin cell assembly process
3. Coin Cell Assembly: 7 Factors Directly Affecting Specific Capacity Results
Specific capacity measurement errors in coin cell testing are rarely caused by the electrochemical testing instrument alone. The following six assembly variables are the primary sources of inter-cell variation and batch-to-batch inconsistency.
3.1 Slurry Mixing Uniformity
Slurry mixing refers to the process of dispersing active material, conductive agent, and binder into a homogeneous high-viscosity suspension. Non-uniform dispersion creates local composition gradients in the dried electrode, resulting in variations in active material loading across punched electrode discs. Mixing equipment selection, rotational speed, mixing time, and temperature must all be controlled to produce a consistently dispersed slurry and, in turn, a uniform electrode coating.

Figure 2. Slurry batching and mixing
3.2 Electrode Coating Uniformity
Laboratory-scale electrode coating typically uses a doctor-blade coater on a flat-bed platform. Blade gap setting controls the wet film thickness and therefore the active material loading per unit area. Before coating, the current collector foil surface and platform must be cleaned thoroughly with ethanol and a lint-free cloth; the foil must lie flat with minimal wrinkling to ensure uniform transfer.
After coating, the electrode must be dried to remove the NMP solvent and residual moisture. Drying temperature directly affects electrode integrity:

Figure 3. Electrode coating

Figure 4. Electrode coating
3.3 Electrode Calendering Uniformity
Electrode calendering is the controlled compression of the dried electrode using a roll press, with the roll gap adjusted to achieve the target electrode density and thickness. Compaction density governs both electron and ion transport within the electrode: excessively high compaction density blocks lithium-ion diffusion pathways, while insufficient compaction increases ohmic resistance. Both conditions suppress material capacity utilization. Consistent control of calendering pressure and compression ratio is therefore essential for producing electrodes with reproducible compaction density across batches.

Figure 5. Electrode calendering
3.4 Moisture Content of Components
Residual moisture in electrode materials, separators, and cell hardware accelerates active material structural degradation, triggers electrolyte decomposition, and generates gas — all of which introduce electrochemical anomalies that can be mistakenly attributed to the material under evaluation. All components must be dried before transfer into the glovebox environment.
3.5 Electrode Punching and Weighing Accuracy
Two precision requirements govern this stage. First, electrode discs must be free of edge burrs after punching; burrs can penetrate the separator and cause internal short circuits. Second, electrode mass must be recorded on a balance with a resolution of 0.01 mg (0.00001 g, i.e., 100,000th-gram precision) or better — coarser balances introduce weighing errors that propagate directly into specific capacity calculations. Before weighing, each disc should be visually inspected to reject electrodes showing coating cracks, material loss, or visible agglomerates.

Figure 6. Electrode punching and weighing
3.6 Coin Cell Assembly Consistency
Coin cell assembly in a glovebox introduces several simultaneous variables, each capable of producing anomalous test results:


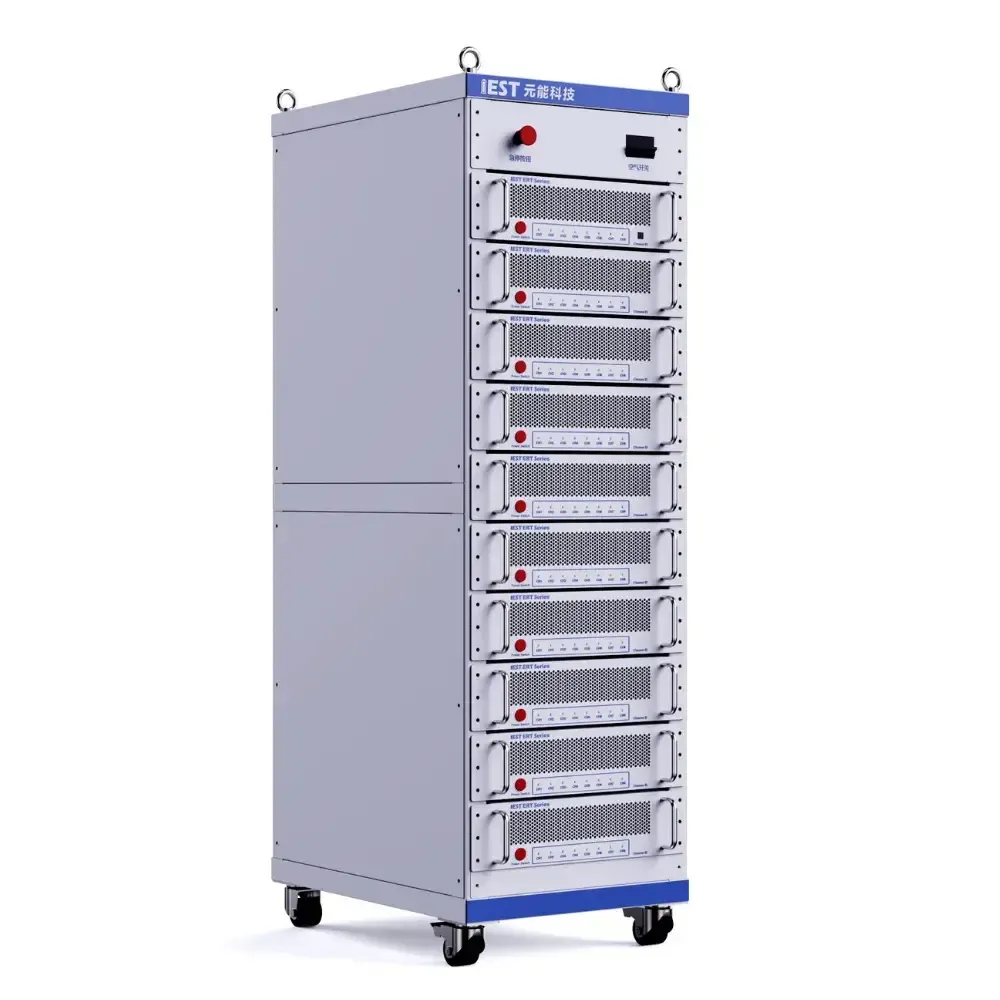
Figure 8. IEST Battery Cycler Electrochemical Analyzer
4. Automated Coin Cell Assembly: Specific Capacity Test Results Across Four Material Systems
To quantify the consistency achievable through automated coin cell assembly, IEST Instrument conducted a multi-material evaluation using the CAAS1200M Automatic Coin-cell Assembly System — a platform designed to eliminate the operator-dependent variability inherent in manual assembly. Electrochemical performance testing was carried out on the ERT5008 (5V / 100 mA) battery cycler.

4.1 Experimental Protocol
4.2 Specific Capacity Test Results
4.2.1 LFP (Lithium Iron Phosphate) Cathode
LFP coin cell results demonstrated comparable consistency. Per-group sigma remained below 0.4 mAh/g for both charge and discharge, range below 1.5 mAh/g, and COV below 0.3% — meeting standard material qualification requirements for commercial LFP evaluation.


Figure 9. LFP Testing Data Statistics
4.2.2 NCM Ternary Cathode
Across 7 parallel groups, NCM coin cells assembled by the CAAS1200M system demonstrated tightly controlled specific capacity distribution. The batch-to-batch mean specific capacity showed minimal drift, with per-group charge/discharge capacity standard deviation (sigma) below 0.4 mAh/g, range (max–min) below 1.5 mAh/g, and coefficient of variation (COV) below 0.2%.


Figure 10. NCM Testing Data Statistics
4.2.3 Graphite Anode
Graphite anode cells exhibited slightly wider discharge variation relative to charge, which is characteristic of the material’s staging behavior. Charge capacity sigma remained below 0.5 mAh/g with a range below 1.5 mAh/g; discharge capacity sigma stayed below 0.8 mAh/g with a range below 2.1 mAh/g. COV for both charge and discharge specific capacity remained below 0.2%.


Fgiure 11. Graphite Testing Data Statistics
4.2.4 Silicon-Based Anode
Silicon-based anodes exhibit larger absolute capacity values and inherently higher volume expansion during cycling, making consistency control more challenging. Nevertheless, the automated assembly system maintained sigma below 6 mAh/g, range below 20 mAh/g, and COV below 0.4% — performance that satisfies typical silicon anode R&D qualification criteria.


Figure 12. Silicon-based Anode Testing Data Statistics
4.2.5 Coin cell specific capacity consistency summary
5. Summary: Automated Coin Cell Assembly as a Solution to Specific Capacity Inconsistency
Specific capacity inconsistency in coin cell testing originates across multiple workflow stages — not from any single source. Slurry preparation, electrode coating and calendering, punching geometry, weighing precision, pre-assembly drying, glovebox environment control, component alignment, crimping pressure, and instrument calibration each contribute independently to inter-cell variance. Addressing only one stage while neglecting the others yields limited improvement.
The multi-material evaluation using the IEST CAAS1200M Automated coin cell assembly system demonstrates that automated assembly can consistently achieve COV values below 0.4% across cathode and anode materials — including silicon-based anodes, which are among the most challenging systems to assemble reproducibly by hand. These results confirm that automated coin cell assembly is a viable replacement for manual assembly in material R&D workflows, enabling higher throughput, reduced retest rates, and faster material qualification cycles.
For teams experiencing persistent specific capacity variance or looking to standardize coin cell testing protocols across multiple operators or laboratories, systematic process control combined with automated assembly is the most direct path to reproducible data.
6. About IEST Instrument — Coin Cell Testing and Electrode Characterization Systems
IEST Instrument develops precision testing systems for lithium-ion and next-generation battery materials, with a portfolio spanning coin cell assembly automation, electrode characterization, and electrochemical performance testing. Key systems relevant to coin cell specific capacity workflows include:
- CAAS1200M Automatic Coin-cell Assembly System — fully automated assembly covering electrode loading, electrolyte dispensing, separator placement, and crimping, with glovebox integration and parameter logging for each assembled cell.
- PRCD3100 Powder Resistivity & Compaction Density Measurement System — measures electrode powder resistivity (up to 200 MΩ) and compaction density under pressures up to 350 MPa, supporting upstream material screening before electrode fabrication.
- BER2500 Electrode Sheet Resistance Tester — directly measures through-thickness electrode resistance including coating resistance and coating–current collector contact resistance, for formulation development and process control.
To discuss automated coin cell assembly requirements or specific capacity testing protocols for your material system, contact IEST Instrument for a technical consultation.